Vectors and Direction
A study of motion will involve the introduction of a variety of quantities that are used to describe the physical world. Examples of such quantities include distance, displacement, speed, velocity, acceleration, force, mass, momentum, energy, work, power, etc. All these quantities can be divided into two categories - vectors and scalars. A vector quantity is a quantity that is fully described by both magnitude and direction. On the other hand, a scalar quantity is a quantity that is fully described by its magnitude. The emphasis of this unit is to understand some fundamentals about vectors and to apply the fundamentals in order to understand motion and forces that occur in two dimensions.
Each of these quantities are unique in that a full description of the quantity demands that both a magnitude and a direction are listed. For example, suppose your teacher tells you "A bag of gold is located outside the classroom. To find it, displace yourself 20 meters."
 This statement may provide yourself enough information to pique your interest; yet, there is not enough information included in the statement to find the bag of gold. The displacement required to find the bag of gold has not been fully described. On the other hand, suppose your teacher tells you "A bag of gold is located outside the classroom. To find it, displace yourself from the center of the classroom door 20 meters in a direction 30 degrees to the west of north." This statement now provides a complete description of the displacement vector - it lists both magnitude (20 meters) and direction (30 degrees to the west of north) relative to a reference or starting position (the center of the classroom door). Vector quantities are not fully described unless both magnitude and direction are listed.
Vector quantities are often represented by scaled vector diagrams. Vector diagrams depict a vector by use of an arrow drawn to scale in a specific direction. Vector diagrams were introduced and used in earlier units
to depict the forces acting upon an object. Such diagrams are commonly called as free-body diagrams.
Representing the Magnitude of a Vector
The magnitude of a vector in a scaled vector diagram is depicted by the length of the arrow. The arrow is drawn a precise length in accordance with a chosen scale. For example, the diagram at the right shows a vector with a magnitude of 20 miles. Since the scale used for constructing the diagram is 1 cm = 5 miles, the vector arrow is drawn with a length of 4 cm. That is, 4 cm x (5 miles/1 cm) = 20 miles. Using the same scale (1 cm = 5 miles), a displacement vector that is 15 miles will be represented by a vector arrow that is 3 cm in length. Similarly, a 25-mile displacement vector is represented by a 5-cm long vector arrow. And finally, an 18-mile displacement vector is represented by a 3.6-cm long arrow. See the examples shown below.
In conclusion, vectors can be represented by use of a scaled vector diagram. On such a diagram, a vector arrow is drawn to represent the vector. The arrow has an obvious tail and arrowhead. The magnitude of a vector is represented by the length of the arrow. A scale is indicated (such as, 1 cm = 5 miles) and the arrow is drawn the proper length according to the chosen scale. The arrow points in the precise direction.
Directions are described by the use of some convention. The most common convention is that the direction of a vector is the counterclockwise angle of rotation which that vector makes with respect to due East.
Vector Addition
A variety of mathematical operations can be performed with and upon vectors. One such operation is the addition of vectors. Two vectors can be added together to determine the result (or resultant). Observe the following summations of two force vectors:
These rules for summing vectors were applied to free-body diagrams in order to determine the net force (i.e., the vector sum of all the individual forces). Sample applications are shown in the diagram below.
In this unit, the task of summing vectors will be extended to more complicated cases in which the vectors are directed in directions other than purely vertical and horizontal directions. For example, a vector directed up and to the right will be added to a vector directed up and to the left. The vector sum will be determined for the more complicated cases shown in the diagrams below.
There are a variety of methods for determining the magnitude and direction of the result of adding two or more vectors. The two methods that will be discussed in this lesson and used throughout the entire unit
are:
- the Pythagorean theorem and trigonometric methods
- the head-to-tail method using a scaled vector diagram
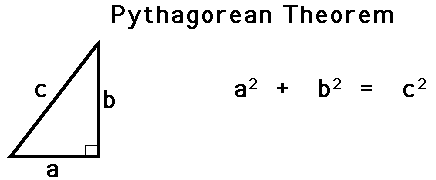
The Pythagorean Theorem
The Pythagorean theorem is a useful method for
determining the result of adding two (and only two) vectors that make a
right angle to each other. The method is not applicable for adding
more than two vectors or for adding vectors that are not at
90-degrees to each other. The Pythagorean theorem is a mathematical equation
that relates the length of the sides of a right triangle to the length of the
hypotenuse of a right triangle.
Eric leaves the base camp and hikes 11 km, north
and then hikes 11 km east. Determine Eric's resulting displacement.
This problem asks to determine the result of adding
two displacement vectors that are at right angles to each other. The result (or
resultant) of walking 11 km north and 11 km east is a vector directed northeast
as shown in the diagram to the right. Since the northward displacement and the
eastward displacement are at right angles to each other, the Pythagorean
theorem can be used to determine the resultant (i.e., the hypotenuse of the
right triangle).
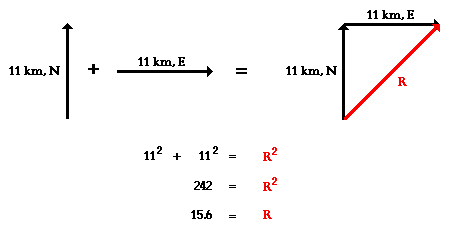
The result of adding 11 km, north plus 11 km, east
is a vector with a magnitude of 15.6 km. Later, the method of determining the direction
of the vector will be discussed.
Resultants
The resultant is the vector sum of two or more vectors. It
is the result of adding two or more vectors together. If
displacement vectors A, B, and C are added together, the result will be vector
R. As shown in the diagram, vector R can be determined by the use of an accurately drawn, scaled, vector addition diagram.
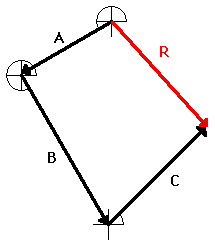
To
say that vector R is the resultant displacement of
displacement vectors A, B, and C is to say that a person who walked with
displacements A, then B, and then C would be displaced by the same amount as a
person who walked with displacement R. Displacement vector R gives the same result as
displacement vectors A + B + C. That is why it can be said that
A + B + C = R

In situations in which vectors are
directed at angles to the customary coordinate axes, a useful mathematical trick
will be employed to transform the vector into two parts with
each part being directed along the coordinate axes. For example, a vector that
is directed northwest can be thought of as having two parts - a northward part
and a westward part. A vector that is directed upward and rightward can be
thought of as having two parts - an upward part and a rightward part.
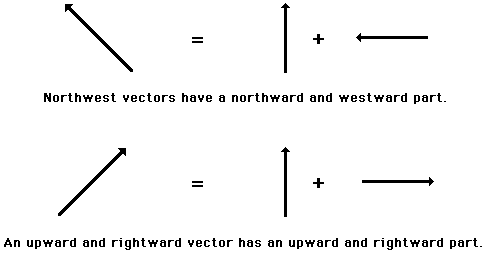
 Any
vector directed in two dimensions can be thought of as having an influence in
two different directions. That is, it can be thought of as having two parts.
Each part of a two-dimensional vector is known as a component. The components of a vector depict the
influence of that vector in a given direction. The combined influence of the
two components is equivalent to the influence of the single two-dimensional
vector. The single two-dimensional vector could be replaced by the two
components.
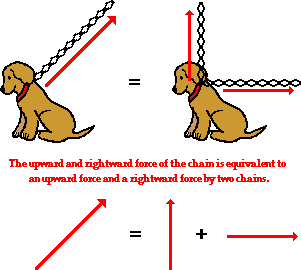
 If Fido's dog chain is stretched upward and
rightward and pulled tight by his master, then the tension force in the chain
has two components - an upward component and a rightward component. To Fido,
the influence of the chain on his body is equivalent to the influence of two
chains on his body - one pulling upward and the other pulling rightward. If the
single chain were replaced by two chains. with each chain having the magnitude
and direction of the components, then Fido would not know the difference. This
is not because Fido is dumb (a quick glance at his picture
reveals that he is certainly not that), but rather because the combined
influence of the two components is equivalent to the influence of the single
two-dimensional vector.
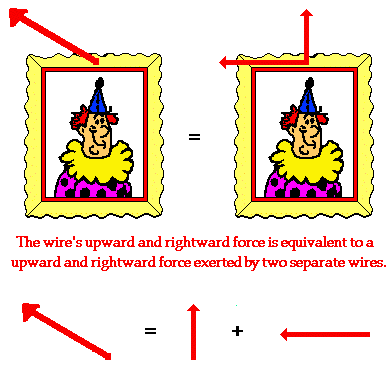
Consider
a picture that is hung to a wall by means of two wires that are stretched
vertically and horizontally. Each wire exerts a tension force upon the picture
to support its weight. Since each wire is stretched in two dimensions (both
vertically and horizontally), the tension force of each wire has two components
- a vertical component and a horizontal component. Focusing on the wire on the
left, we could say that the wire has a leftward and an upward component. This
is to say that the wire on the left could be replaced by two wires, one pulling
leftward and the other pulling upward. If the single wire were replaced by two
wires (each one having the magnitude and direction of the components), then
there would be no affect upon the stability of the picture. The combined
influence of the two components is equivalent to the influence of the single
two-dimensional vector.
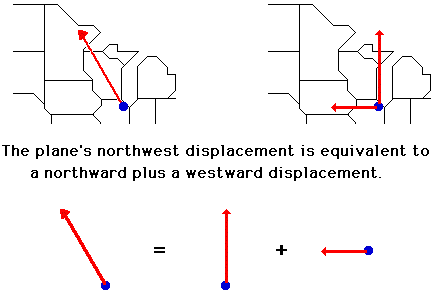
Consider an airplane that is flying from Chicago's
O'Hare International Airport to a destination in Canada. Suppose that the plane
is flying in such a manner that its resulting displacement vector is northwest.
If this is the case, then the displacement of the plane has two components - a
component in the northward direction and a component in the westward direction.
This is to say that the plane would have the same displacement if it were to
take the trip into Canada in two segments - one directed due North and the
other directed due West. If the single displacement vector were replaced by
these two individual displacement vectors, then the passengers in the plane
would end up in the same final position. The combined influence of the two
components is equivalent to the influence of the single two-dimensional
displacement.
Any vector directed in two dimensions can be
thought of as having two different components. The component of a single vector
describes the influence of that vector in a given direction.
APPLICATIONS OF VECTORS IN
EVERYDAY LIFE
There are lots of things related to vectors. Examples are airline pilots, sea captains, doctors tracking the progress of an epidemic, meteorologists tracking weather systems, engineers of every kind dealing with forces and motion, scientists, astronauts, etc.
In everyday life, from waking up we already encounter these things. From your bed you go to the bathroom then back to your room, then to the kitchen. Walking alone is related to vectors. Also, when we run and drive, these things involve both magnitude and direction - which are vector quantities.


